Interaction Analysis
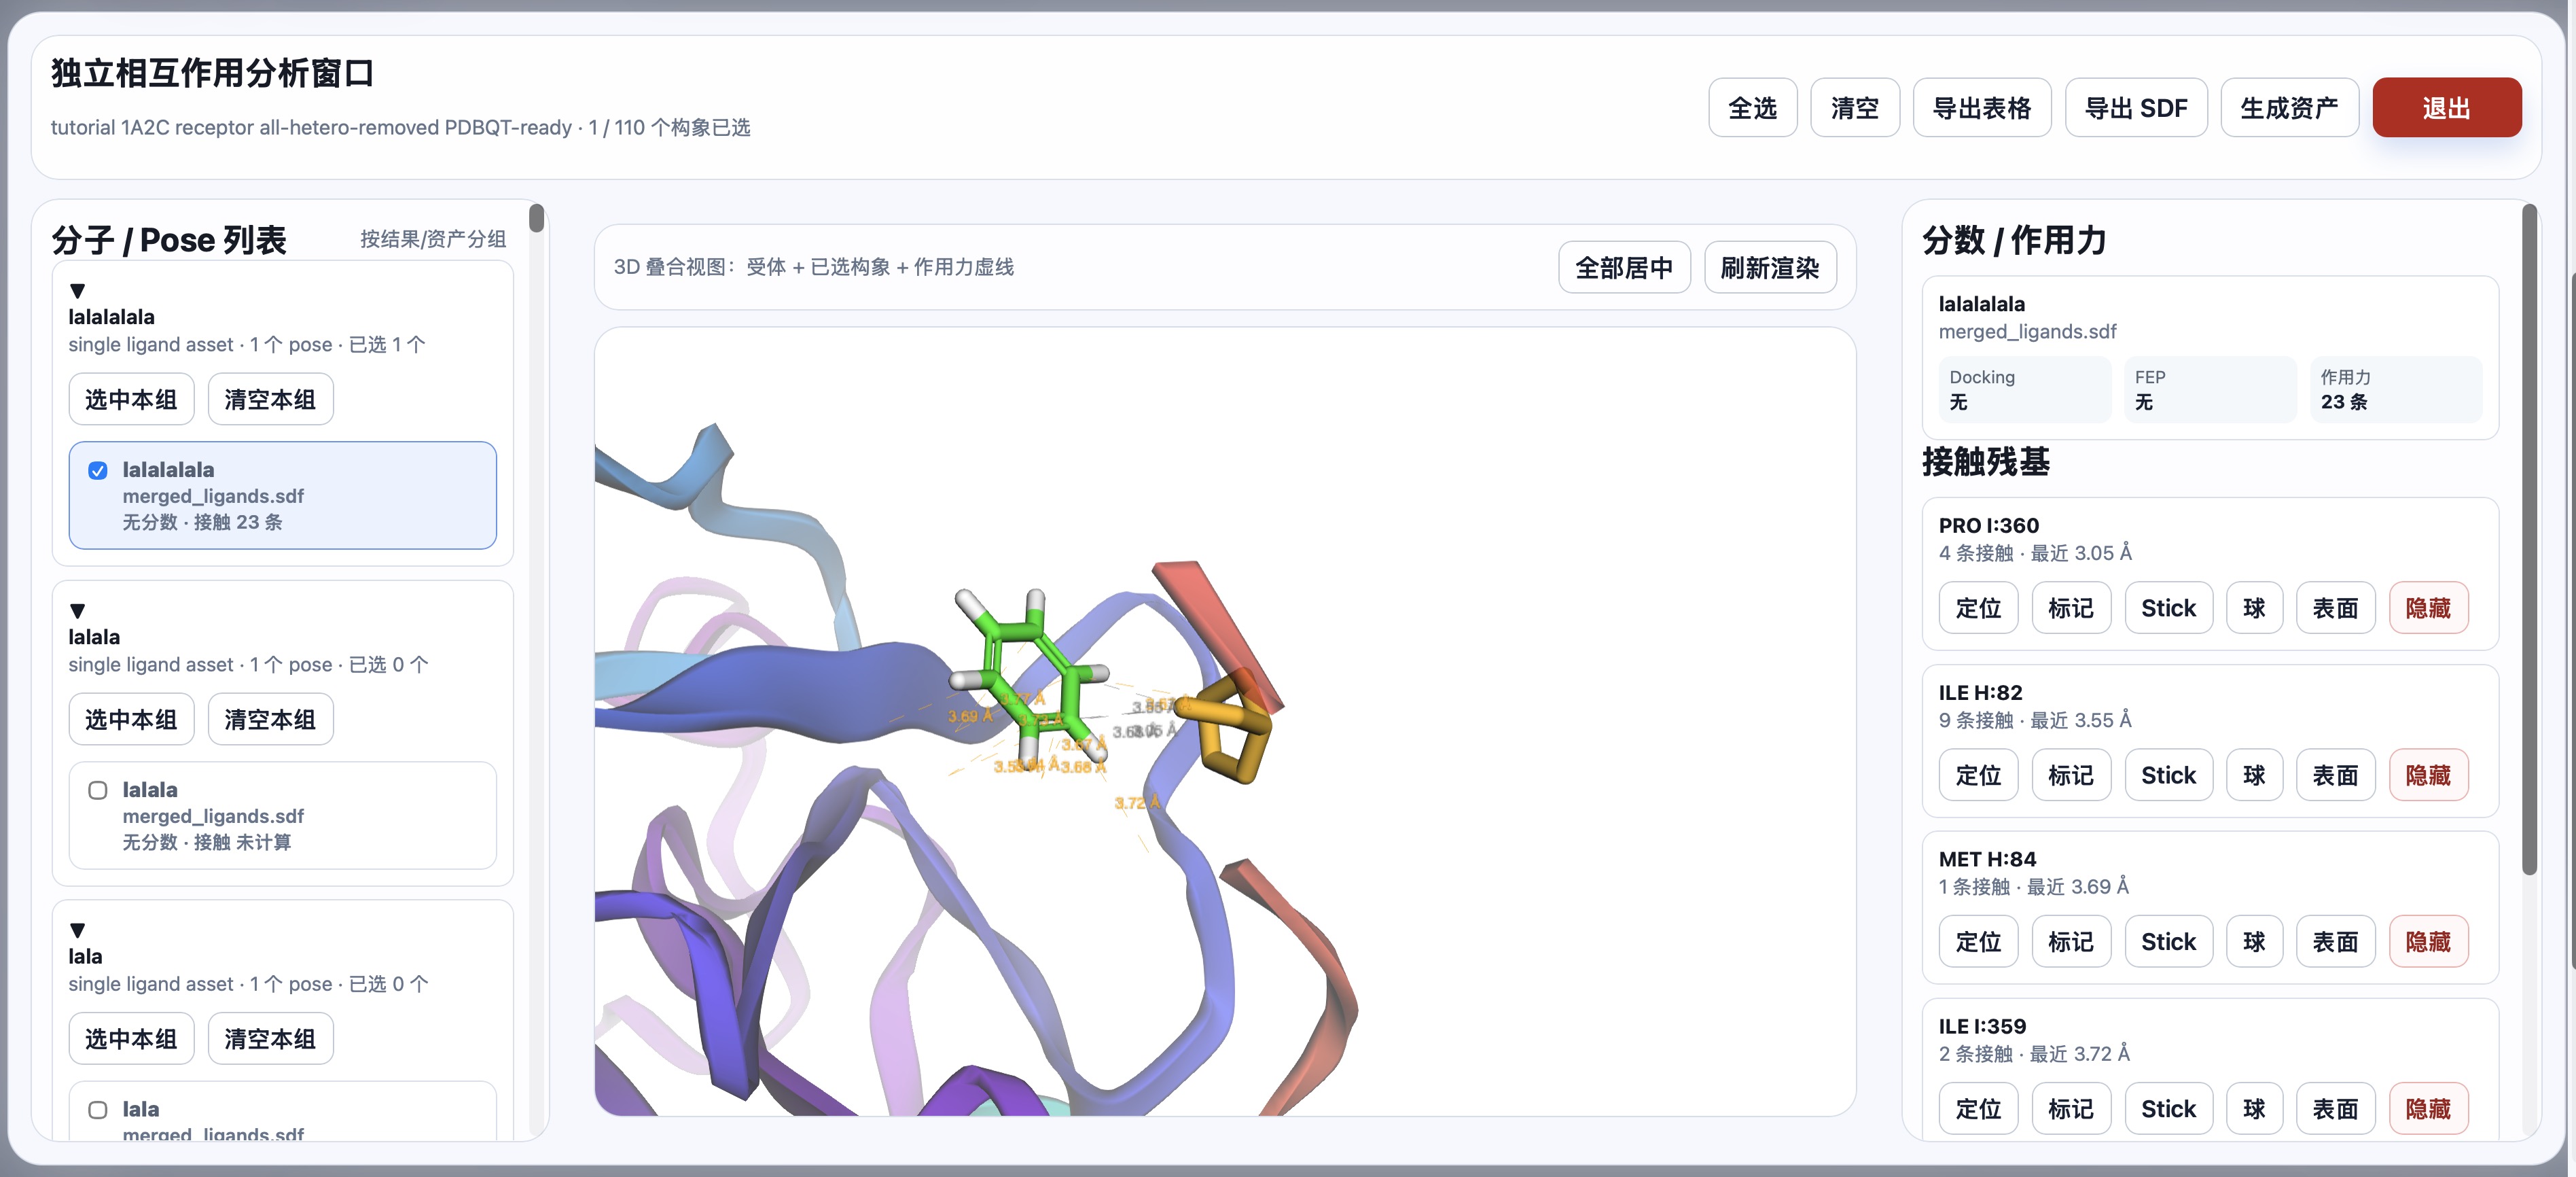
Interaction analysis places the receptor, selected ligand conformations, and geometric contact results in the same standalone window, making it easy to quickly inspect binding modes from docking or molecule generation results.
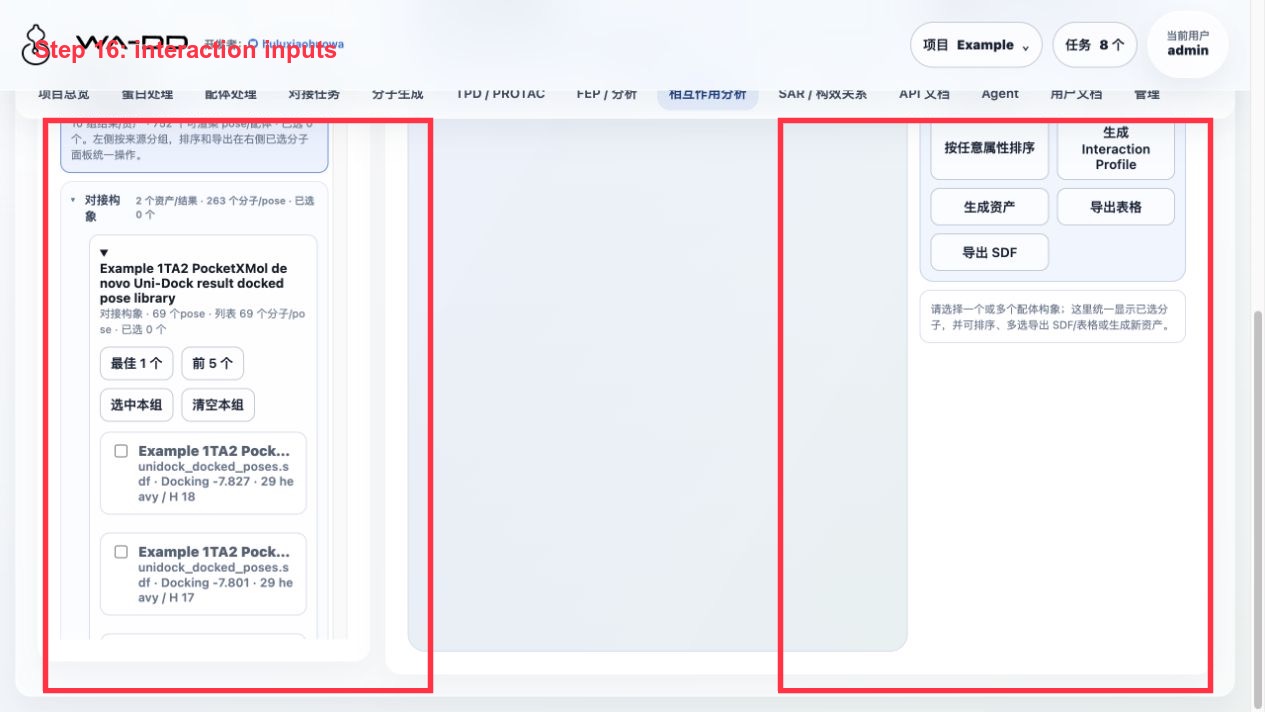
Inputs
- Receptor context: select the corresponding
prepared_proteinorpocketasset. - Ligand conformations: select an uploaded 3D SDF, a
prepared_ligand, or conformations from docking/generation results.
When using a 3D SDF with explicit hydrogens, the system renders and analyzes it according to the stored structure; if the input has no explicit hydrogens, first confirm whether it is suitable for the current hydrogen-bond-sensitive analysis.
Workflow
- Open interaction analysis and select the receptor and ligand sources.
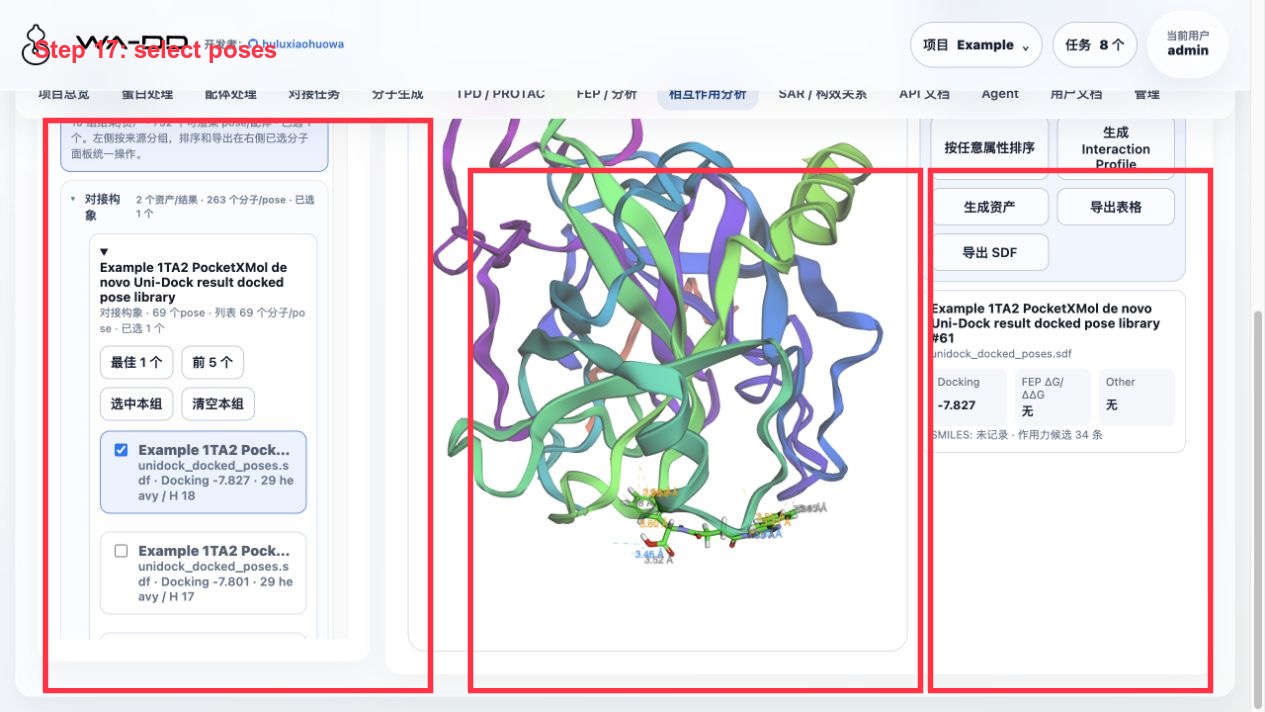
- On the left, expand molecules or poses grouped by result/asset, and check the conformations you want to compare.
- In the middle 3D view, inspect the receptor, ligand, and force dashed lines; use "Center all" and "Refresh rendering" to adjust the view.
- On the right, view the contact count and closest distance for each contact residue; you can locate, label, toggle Stick/ball/surface display, or hide that residue.
- Export the table or selected conformation SDF as needed, and generate reusable assets from the selected conformations for downstream docking, SAR, or FEP use.
Server6 Example: analysis using 1TA2 docking and FEP outputs
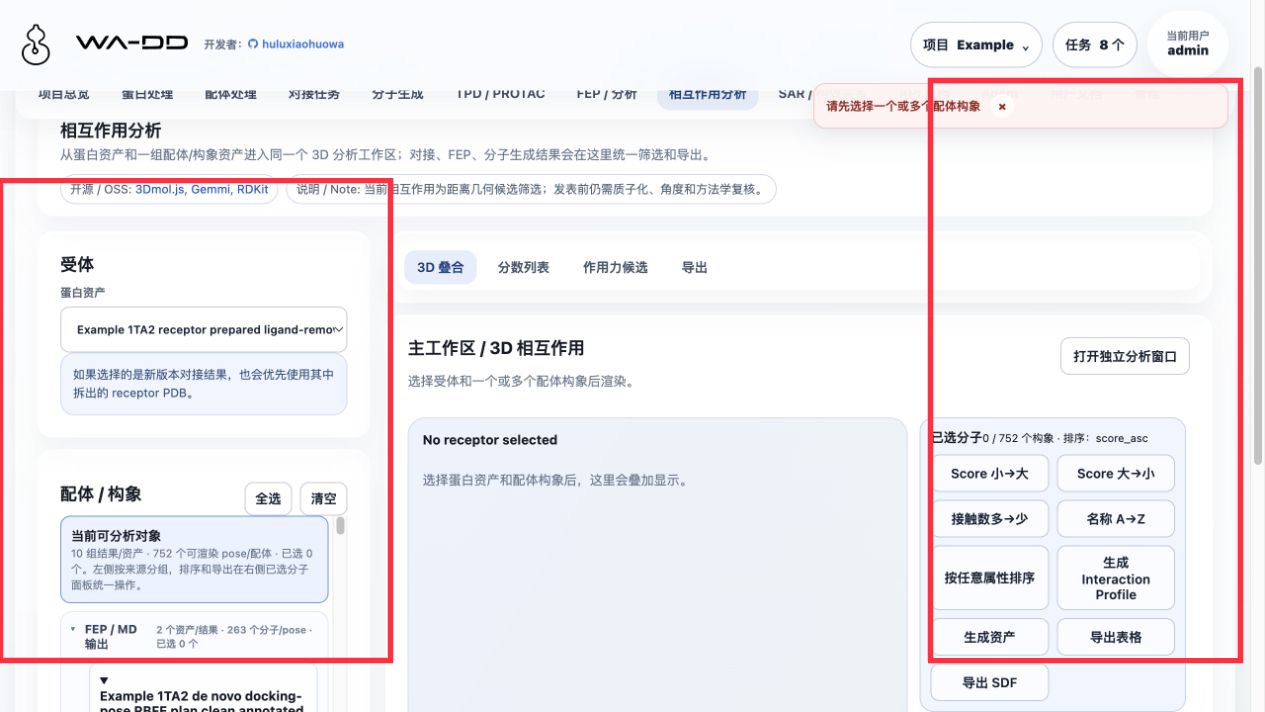
This example is completed in the Example project on server6. The page displays different sources uniformly grouped: FEP/MD outputs, docking conformations, molecule generation, prepared ligands, and raw imports/edits.
Steps:
- Enter "Interaction analysis".
- Select
Example 1TA2 receptor prepared ligand-removedas the receptor. - In the "Ligand / Conformation" area, expand the source groups, for example:
FEP / MD outputsDocking conformationsMolecule generation- Click
Best 1orTop 5in an asset group, or check specific molecules/poses one by one. - The middle 3D area shows the receptor + selected conformations + force dashed lines; the right side shows scores, force counts, and contact residues.
- Export using the buttons on the right:
Export table: molecule name, SMILES, docking score, FEP fields, and force statistics.Export SDF: conformations and SDF properties of the selected molecules.Generate asset: save the selected molecules as a new SDF asset.
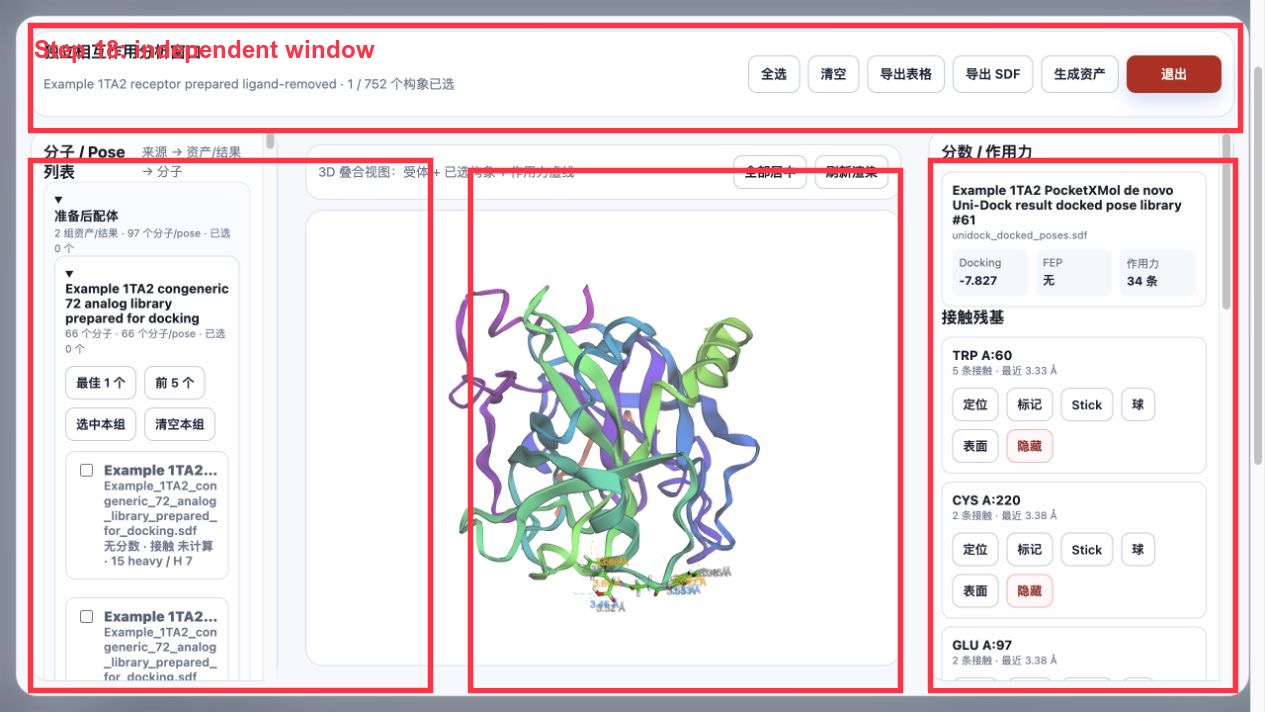
Standalone window:
- You must select at least one molecule/pose first.
- Click
Open standalone analysis window. - The standalone window retains the select-all, clear, export table, export SDF, generate asset, and exit buttons.
Result interpretation:
Dockingis the Uni-Dock/Vina docking score; more negative is usually better, but it is not the experimental binding free energy.FEPfields come from thefep_outputSDF. A dry-run only shows planned edges and does not represent real ΔΔG.Forcesare currently distance-based geometric candidate screening; before publication, more complete tools (such as PLIP/RDKit profiler or experimental structure review) should be used to confirm protonation, angles, donor/acceptor relationships, and interaction types.- The residue card on the right can be located, labeled, toggled to Stick/ball/surface, or hidden, to help judge which residue a dashed line corresponds to.
Outputs
- Residue contact and geometric distance tables, which can be exported as a table.
- A merged SDF of the selected conformations, which can be exported or saved as a new asset.
- The interaction data produced by docking jobs can be retrieved together with
wa_dd_interactions.jsoninside theresultasset.
Notes
- The selection, export, and downstream use of multiple conformations are all handled as task-level SDF assets, preserving the name and metadata of each record.
- This module is used to inspect geometric contact candidates (such as hydrogen bonds, hydrophobic contacts, and halogen bond candidates) and should not be taken directly as experimental binding evidence.